Prometheus 使用手册
参考
架构
- 高可用:
- 双Server实例模型
- 双AlertManager+Nginx的LB
- 数据存储策略:冷热分离
- 2周内数据:Prometheus-Server的本地存储
- 2周以外数据:远程写入ES
- 支持告警规则动态加载:
- 基于联邦模型,规则加载在上层Prometheus-Server下,实现蓝绿切换
- 告警规则存储在git中,定期检查更新
graph TD
Alertmanager集群 -->|接收| Prometheus1
Alertmanager集群 -->|接收| Prometheus2
Prometheus1 -->|拉| PushGateway
Prometheus1 -->|拉| Exporter
Prometheus2 --> PushGateway
Prometheus2 --> Exporter
Prometheus2 -->|远程写| Kafka
Kafka -->|logstash消费| ES
安装
环境准备
- 升级yum源,参考:https://developer.aliyun.com/mirror/centos
- 配置时间ntp同步,TSDB核心指标
- 适配docker,升级内核,参考
- 安装docker-ce,参考
配置
# 在"/opt/prometheus"下生成配置prometheus.yml
global:
  scrape_interval:     15s  # 采集间隔时间
  evaluation_interval: 15s  # 执行规则的间隔时间
rule_files:  # 加载规则
  - "first.rules.yml"  # 适配下文的自定义Metric
  - "alert_example.rules.yml"  # 适配下文的自定义告警
scrape_configs:  # 监控目标
  - job_name: prometheus
    static_configs:
      - targets: ['localhost:9090']  # 默认采集HTTP地址:http://localhost:9090/metrics
  - job_name: node  # 适配下方的主机节点监控
    scrape_interval: 5s  # 覆盖全局变量

    file_sd_configs:  # 读服务发现目标文件,支持*通配符,适配下文服务发现
      - files:
        - sd_config.json
        refresh_interval: 10m  # 10分钟执行一次发现,默认5m
    static_configs:
      - targets: ['宿主机IP:9100']  # 如果server是docker启动,这里需要明确ip
        labels:
          group: 'dev'  # 自定义标签,dev组
# 对接Alertmanager
alerting:
  alertmanagers:
    - static_configs:
        - targets:
          - '宿主机IP:9093'
启动
# 指定配置路径,暴露9090端口,限制最大内存,数据保留7天
docker run -d --name=prometheus \
    -m 4G \
    --restart=always \
    -p 9090:9090 \
    -v /opt/prometheus:/etc/prometheus \
    prom/prometheus:v2.19.3

# 带参数启动
docker run \
  --name=prometheus \
  --volume=/opt/prometheus:/etc/prometheus \
  --volume=/prometheus \
  -p 9090:9090 \
  --restart=always \
  --detach=true prom/prometheus:v2.19.3 \
  --storage.tsdb.retention.time=7d \
  --config.file=/etc/prometheus/prometheus.yml \
  --storage.tsdb.path=/prometheus \
  --web.console.libraries=/usr/share/prometheus/console_libraries \
  --web.console.templates=/usr/share/prometheus/consoles
使用
主机Node Exporter
# 下载组件
wget https://github.com/prometheus/node_exporter/releases/download/v1.0.1/node_exporter-1.0.1.linux-amd64.tar.gz
# 解压后启动
tar xvfz node_exporter-1.0.1.linux-amd64.tar.gz
mv node_exporter-1.0.1.linux-amd64/ node_exporter
cd node_exporter/
nohup ./node_exporter &
注意:关闭主机上防火墙systemctl stop firewalld
自定义Metric
适用于原有数据的预计算。
# 在"/opt/prometheus"下生成yml规则文件 first.rules.yml
groups:
- name: cpu-node
  rules:
  - record: job_instance_mode:node_cpu_seconds:avg_rate5m  # 每秒CPU时间速率,按照job、实例、模式区分,5分钟均值
    expr: avg by (job, instance, mode) (rate(node_cpu_seconds_total[5m]))
# 验证规则文件是否正确
promtool check rules first.rules.yml
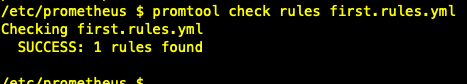
页面效果如下 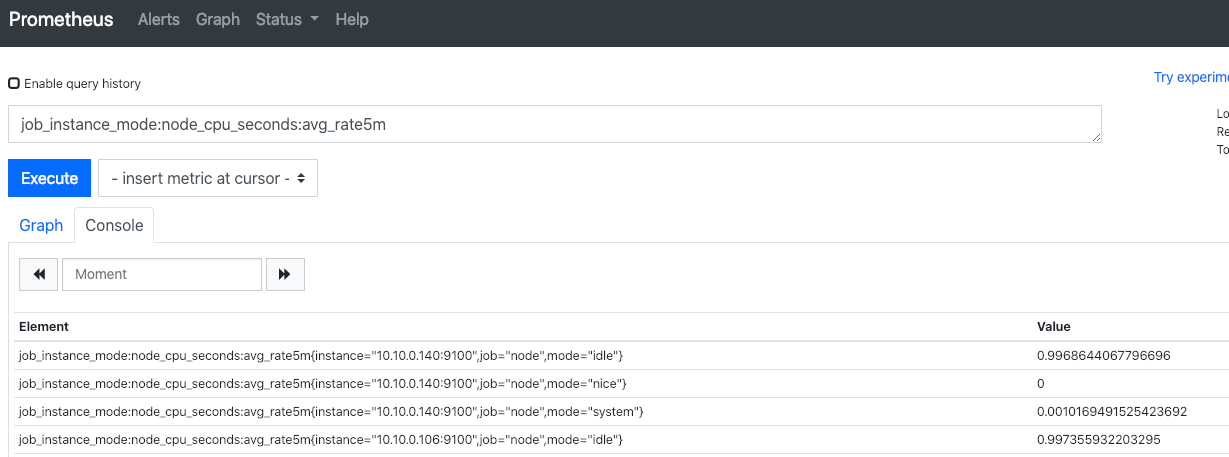
自定义告警
# 在配置目录下定义告警规则文件 alert_example.rules.yml
groups:
- name: alert_example
  rules:
  - alert: node_cpu_seconds_avg_rate5m
    expr: job_instance_mode:node_cpu_seconds:avg_rate5m  > 0.5
    for: 2m
    labels:
      alert_label: demo
    annotations:
      summary: "Test Alert: {{ $labels.instance }}"
      description: "测试 {{ $labels.instance }} of job {{ $labels.job }} has been > 0.5"
在Prometheus的conf中启用,效果如下 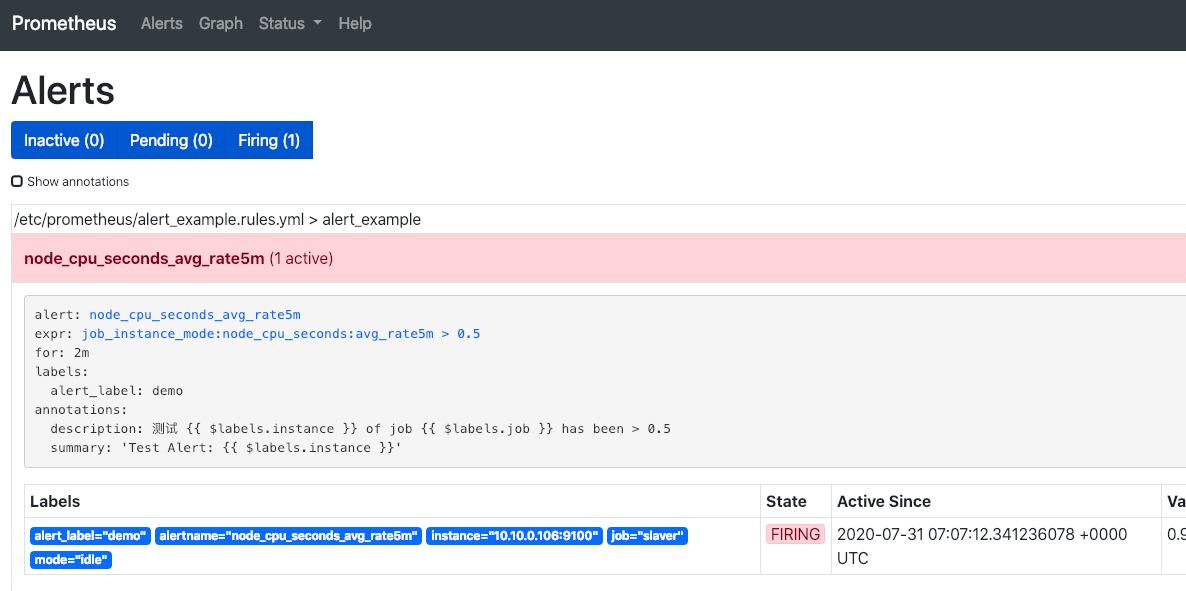
服务发现基于文件
// 在配置目录下定义监控服务目标的 sd_config.json
[
  {
    "targets": ["10.10.0.106:9100"],
    "labels": {
      "env": "dev",
      "job": "slaver"  // 会覆盖上层label
    }
  }
]
在Prometheus的conf中启用,效果如下 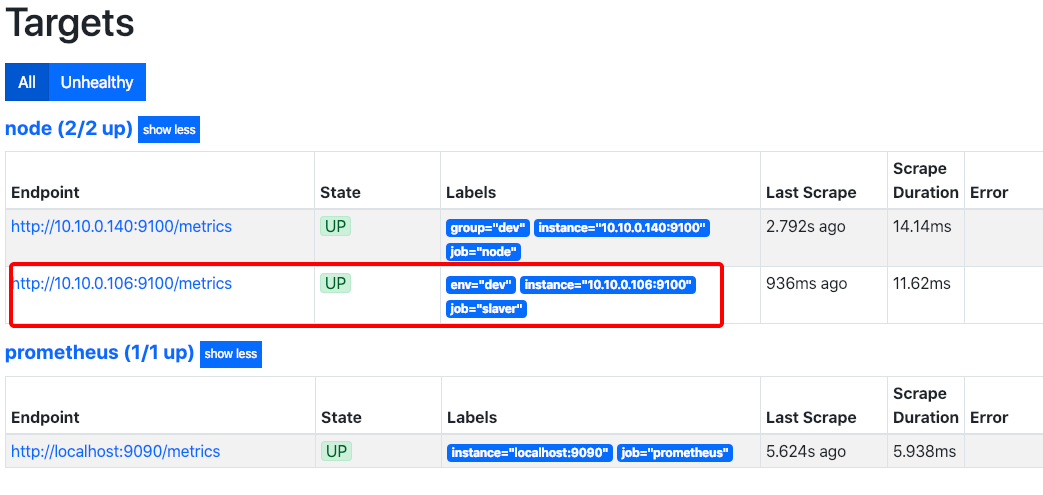
常用PromQL举例
# 瞬时向量表达式:按照bu, product维度区分,计算指标和
sum(es_inte_applog_error_count_group_by_servername_last_min) by (bu, product)

# 瞬时向量表达式:按照bu, product维度区分,计算指标和,5分钟前的数据
sum(es_inte_applog_error_count_group_by_servername_last_min offset 5m) by (bu, product)

# 计算指标个数
count(es_inte_applog_error_count_group_by_servername_last_min)

# 区间向量表达式:只能用于表格,获取指定指标 5分钟内的所有样本数据
es_inte_applog_error_count_group_by_servername_last_min{product="INS"}[5m]

# 瞬时向量表达式:获取指定指标 5分钟内的所有样本数据之和  sum_over_time(range-vector):指定时间间隔内所有值的总和
sum_over_time(es_inte_applog_error_count_group_by_servername_last_min{product="INS"}[5m])

# 瞬时向量 按业务线区分,某指标的平均1分钟内和,由于Prometheus15秒pull次,会导致1分钟内指标读4次(4个点),所以用avg_over_time取区间均值
sum(avg_over_time(es_inte_applog_error_count_group_by_servername_last_min[1m])) by (bu)

# 计算平均1分钟,2xx在总量中的%
sum(avg_over_time(es_prod_accesslog_status_count_group_by_host_last_min{status=~'2.+'}[1m])) /sum(avg_over_time(es_prod_accesslog_status_count_group_by_host_last_min[1m]))
性能压测报告
测试主机配置:4C8G
- 不限制docker内存
- 压测到22个avalanche实例时,达到24k的QPS,内存占用7.7G,随后卡机
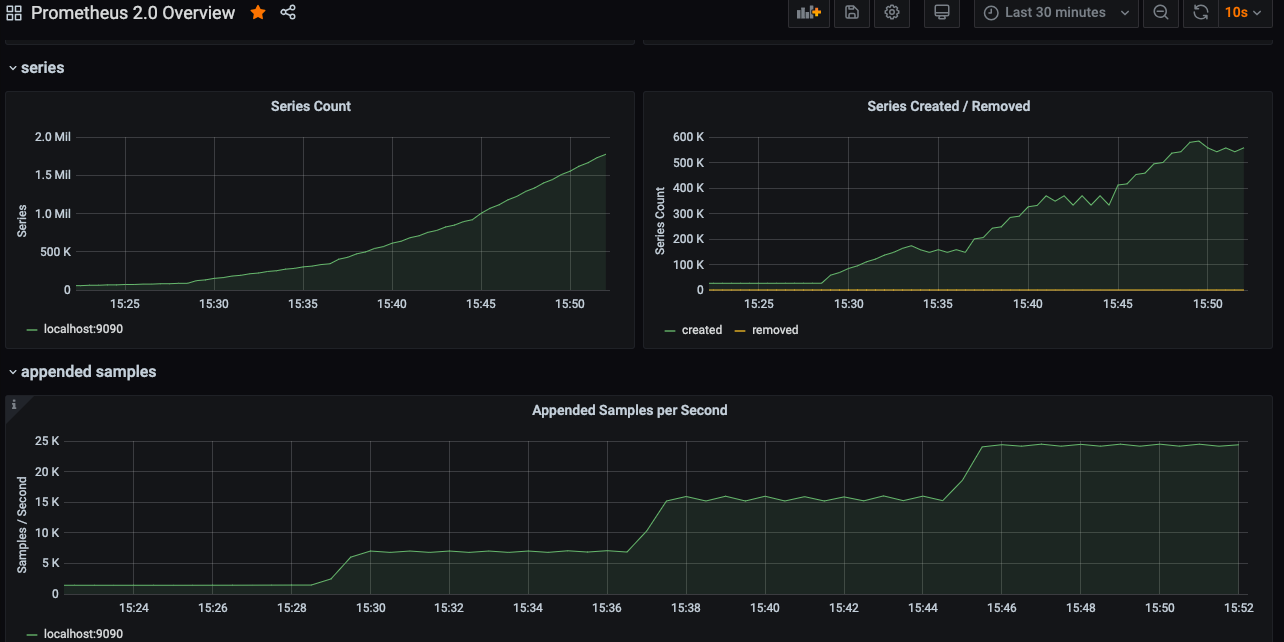
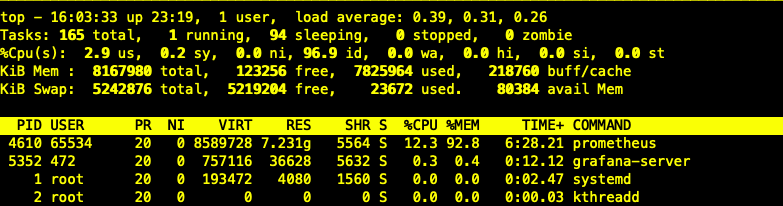
- 主机CPU负载不大,内存占用持续增加,上不封顶
- 在停止Prometheus服务时,主机负载瞬间飚高,造成VM卡住,最后重启恢复
- 限制Prometheus容器内存4G
- 14节点=15.5kQPS,内存~=3.9G,容器内存基本打满,出现服务不稳定,执行查询时间变长,QPS突然下降,主机负载开始升高,从0.x升到4,大量磁盘IO
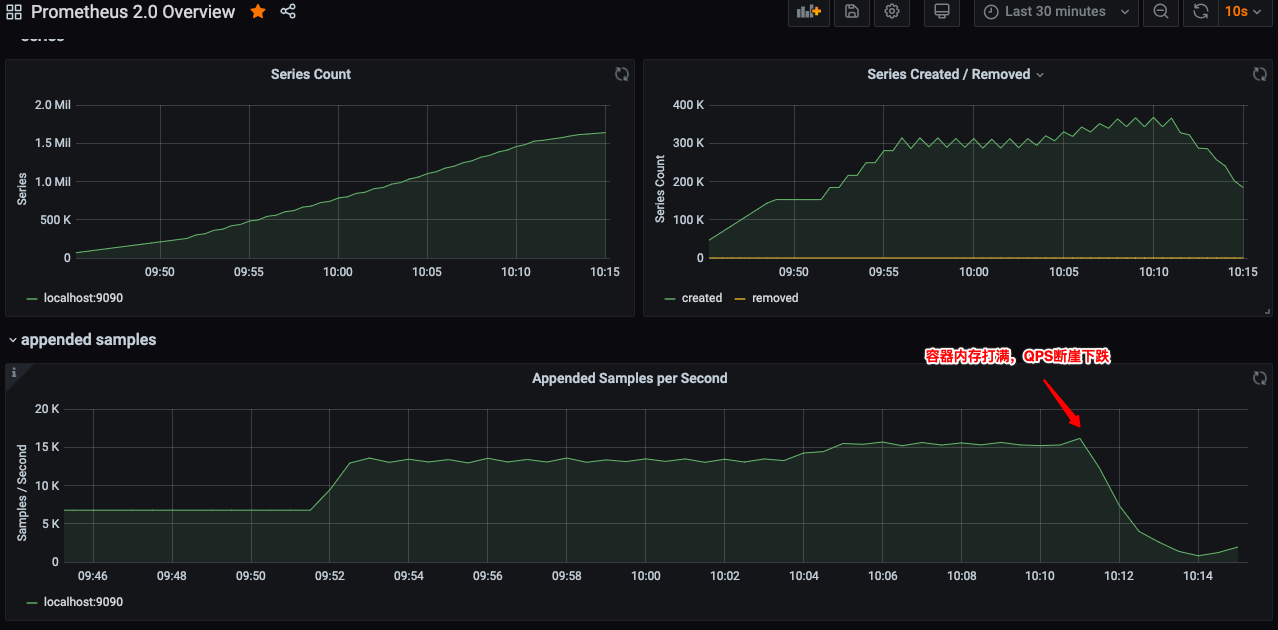
- 降低节点数到12后,主机磁盘下降,服务恢复正常,但是内存未释放
结论:
- Prometheus是以Go语言开发,所以并发性能非常强,但是以消耗内存为代价
- 单实例4G的Prom能支撑12.5K的QPS
- 当出现查询卡顿时,可以判断采集服务出现问题
- 在实际使用中,必须限制内存,否则会吃光
- 恢复策略建议:不要恢复原实例,以丢失原数据为代价,开一个新实例